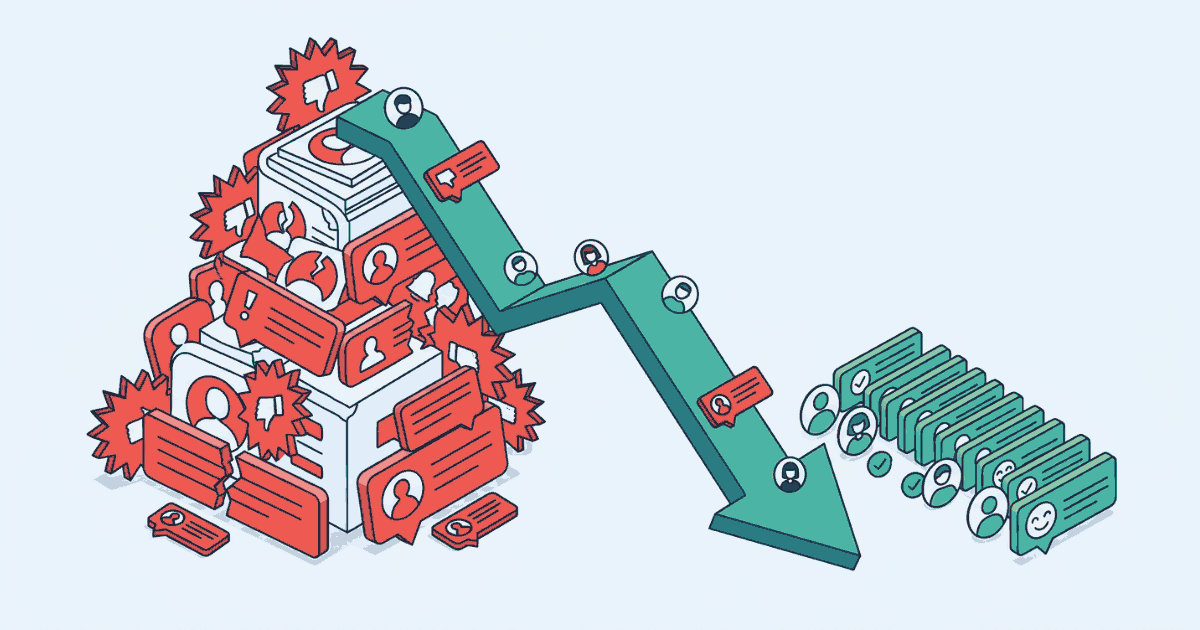
In the Word Category, Negative Reviews Climbed From 10.6% to 19.3% in Five Months
Sourced from real App Store and Google Play review data in Appeye's catalogue.
Figures as of 30 September 2026.

- rise in negative review share, Feb–Jul 2026
- 8.7pp
- negative reviews in July 2026, the peak month measured
- 19.3%
- Word category reviews analyzed, Feb–Jul 2026
- 2,563
- month-over-month comparisons where sentiment worsened
- 4 of 5
Key takeaways
- Negative review share in Word apps rose from 10.6% to 19.3% between February and July 2026, an 8.7 point increase.
- Sentiment worsened in 4 of the last 5 month-over-month comparisons tracked.
- Review volume surged alongside the negativity: July's 1,344 reviews made up 52.4% of the entire six-month total.
- The trend is concentrated in two recent, high-volume months, not spread evenly across the period measured.
Word apps had a quiet spring and a loud summer. Reviews in this category stayed under 15% negative from February through May 2026, then the negative share climbed to 19.3% by July - the same month the category's review volume hit its highest point of the period we tracked.
As of 30 September 2026, Appeye's tracking showed negative reviews in the Word category rising from 10.6% in February to 19.3% in July, an increase of 8.7 percentage points across six months and 2,563 reviews. Sentiment worsened in four of the five month-over-month comparisons - the only pause came between April and May, when the negative share held almost flat at 13.5%.
Trend
The volume behind those numbers shifted just as sharply. Monthly reviews ran between 99 and 156 from February through May, then jumped to 698 in June and 1,344 in July - meaning more than half of all reviews in the six-month window, 52.4%, arrived in July alone, right as the negative share peaked.
52.4%of all six months' reviews arrived in July alone
That timing matters for how the finding should be read. A worsening trend built mostly on two heavy months says more about what happened in June and July specifically than about a slow year-long decline, and it doesn't tell us whether the shift is spread across many Word apps or concentrated in a handful of them.
This is a trend built mostly on two months - June and July together produced almost four times as many reviews as the previous four months combined.
What exactly did Appeye measure?
The share of negative reviews left for apps in the Word category, tracked month by month from February to July 2026, based on 2,563 reviews in total. The measurement was run as of 30 September 2026.
How big is the shift, really?
Negative reviews went from 10.6% of the total in February to 19.3% in July, an 8.7 percentage point rise. Sentiment worsened in 4 of the 5 month-over-month steps, with the only flat stretch between April and May.
Could the jump in review volume be driving this, rather than genuine dissatisfaction?
It's a fair question, and the volume pattern is striking: monthly reviews stayed under 160 from February through May, then hit 698 in June and 1,344 in July. July alone accounts for 52.4% of all 2,563 reviews in the window, so the overall trend is weighted heavily toward what happened in those last two months.
Does this apply to every Word app, or is it concentrated in a few?
The data is a catalogue-wide aggregate for the category, so it can't distinguish between many apps drifting slightly worse and a small number of high-volume apps pulling the average up. Anyone acting on this number should check their own app's review trend rather than assume it mirrors the category.
Is 19.3% negative high compared to other app categories?
This dataset only covers the Word category's own trend over time, not a comparison against other categories, so there's no basis here for saying whether 19.3% is unusually high or simply typical for apps of this kind.
What should someone do with this finding?
Treat June and July 2026 as the period to investigate first - look for updates, platform changes, or pricing shifts that landed around then, since that's when both the review volume and the negative share moved together. A single aggregate trend line is a starting point for questions, not a verdict on any individual app.
What this means for you
- Marketer
- If you run campaigns for a Word app, June and July 2026 are worth a closer look - that's when both review volume and negative sentiment jumped together, which usually points to something specific (an update, a promotion, a platform change) rather than a slow drift.
- App owner
- Check whether your own app's review pattern matches this shape - a flat winter/spring followed by a June-July spike in both volume and negativity - before assuming the category-wide number applies to you directly.
- Agency
- When benchmarking Word category clients against this figure, note that it's aggregated across the whole catalogue and weighted heavily toward two recent months; ask for the client's own monthly breakdown before citing 19.3% as their competitive backdrop.
See how your app compares
Search Appeye for any app to see its real store-by-store scores, review themes and category rank.
Search appsGet new review-data posts by email
One short email when a new Industry Watch or data-driven post goes live. We send a confirmation link first, and every email has a one-click unsubscribe.