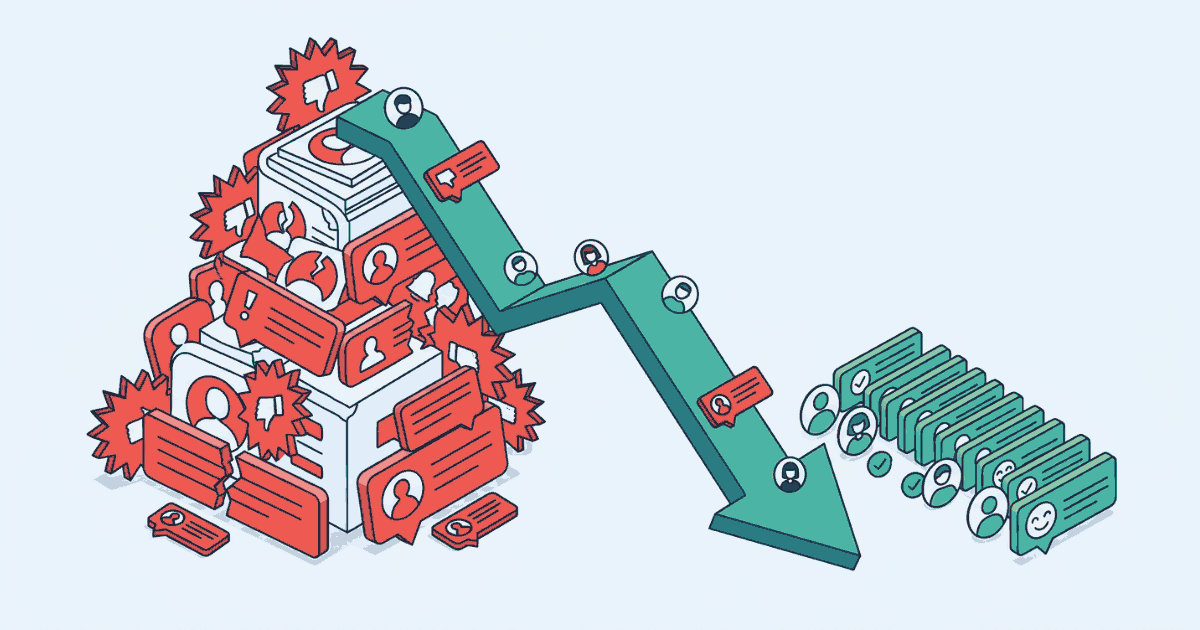
Events Apps Split Down the Middle: 73.1% Five-Star, But Negative Share Runs 6.9 Points Above Catalogue Average
Sourced from real App Store and Google Play review data in Appeye's catalogue.Events in the catalogue
Figures as of 27 September 2026.
- Events apps measured, 27 Sep 2026
- 40
- 5-star reviews in Events
- 73.1%
- negative (1-2★) share in Events
- 17.7%
- catalogue-wide average negative share
- 10.8%
Key takeaways
- Events apps are bimodal: 73.1% five-star, 15.9% one-star, almost nothing in between
- Negative share (17.7%) ran 6.9 points above the 10.8% catalogue average on 27 Sep 2026
- Ratings of 2, 3, and 4 stars combined made up just 11% of reviews across the 40 apps measured
Events apps look great on paper until you notice how few reviewers landed in the middle. As of 27 September 2026, across the 40 apps Appeye tracks in the Events category, 73.1% of reviews were 5-star. That's the kind of number a screenshot gets built around. But sitting right next to it, in the same 40-app cohort, is a 1-star share of 15.9% — and almost nothing in between.
Put the two together and the category's negative share (1-star plus 2-star reviews) comes to 17.7%. Across the whole catalogue, the average negative share on the same measurement date was 10.8%. Events apps are running 6.9 percentage points hotter on negative reviews than the typical app Appeye tracks, even while carrying one of the higher 5-star rates in the data.
Split
- 1★15.9%
- 2★1.9%
- 3★1.9%
- 4★7.2%
- 5★73.1%
What's missing is the middle. 2-star reviews sit at 1.9%, 3-star at 1.9%, 4-star at 7.2% — three ratings that together add up to 11%, less than a sixth of the 5-star share alone. In the secondary breakdown, positive (4-5 star) reviews come to 80.3% and neutral (3-star) reviews to just 1.9%. Reviewers of Events apps, on this data, are not grading on a curve. They are either delighted or done.
Negative reviews make up 17.7% of Events apps' ratings, versus a 10.8% catalogue average — a 6.9-point gap on the same measurement day.
This is a distribution finding, not a causal one — the data doesn't say why Events apps polarize, only that they do, and that the gap between this category's negative share and the catalogue's is real and measured on the same day across the same 40 apps. It's also worth being precise about scope: this is one category, one date, one cohort size. A category-wide negative share of 17.7% at 40 apps is a different statement than the same figure would be at 400, and it should be re-measured before anyone treats it as fixed.
Distribution
Events: star rating split
- 1-2*17.7%
- 3*1.9%
- 4-5*80.3%
What it does mean, on the numbers as they stand, is that anyone benchmarking an Events app against "the average app" is benchmarking against the wrong shape of distribution. A negative share close to 10.8% might read as normal catalogue-wide and as underperforming inside Events, where 17.7% is closer to par. The category doesn't reward being merely fine — it seems to produce apps that either land the event experience or visibly don't, with very little room recorded in between.
11%share of reviews rated 2, 3, or 4 stars combined
What this means for you
- Marketer
- A 73.1% five-star rate looks strong in isolation, but the 17.7% negative share sitting alongside it means the same app is generating polarizing word of mouth — worth testing messaging against both ends, not just the top rating.
- App owner
- If your Events app's negative share is near or below 10.8%, you're outperforming the category norm of 17.7%; if it's above that, the 15.9% one-star figure suggests a real, sizeable unhappy cohort rather than noise.
- Agency
- Don't benchmark Events clients against catalogue-wide negative share (10.8%) — the category's own norm on 27 September 2026 was 17.7%, so a client sitting at 12-14% may already be beating its peers.
Explore this in the catalogue
All Events apps (54 tracked)
See how your app compares
Search Appeye for any app to see its real store-by-store scores, review themes and category rank.
Search appsGet new review-data posts by email
One short email when a new Industry Watch or data-driven post goes live. We send a confirmation link first, and every email has a one-click unsubscribe.