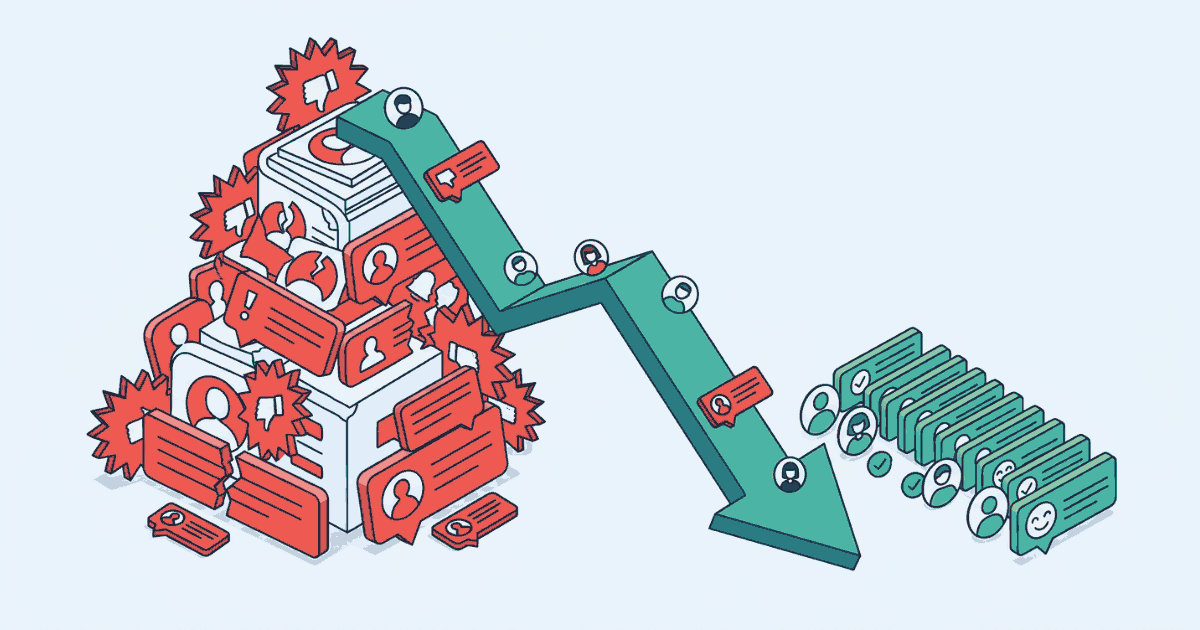
Graphics & Design's Negative Review Share Fell From 33.1% to 22.5% in Six Months
Sourced from 10,335 real App Store and Google Play reviews in Appeye's catalogue.
Figures as of 9 September 2026.

- change in negative review share, Feb-Jul 2026
- -10.6pp
- negative review share, Feb 2026 to Jul 2026
- 33.1% → 22.5%
- reviews measured across the six-month window
- 10,335
Key takeaways
- Negative review share fell from 33.1% (Feb 2026) to 22.5% (Jul 2026), a 10.6pp drop.
- 4 of the 5 month-to-month moves were in the improving direction; June rose from 26.3% to 28.0% before falling again.
- Review volume grew nearly 5x over the window, from 683 to 3,339 monthly reviews.
- Measured 9 September 2026, across 10,335 reviews total for the six-month period.
Design tools have a rough reputation with reviewers. Crashes on export, subscriptions that feel steep for a filter pack, features locked behind a paywall halfway through a project - it is a category that tends to collect one-star complaints. So when the negative share moves, it is worth writing down exactly when and by how much, before the number quietly stops meaning what it once meant.
As of 9 September 2026, Appeye's tracking of the Graphics & Design category showed the share of negative reviews falling from 33.1% in February 2026 to 22.5% in July 2026 - a drop of 10.6 percentage points over six months, drawn from 10,335 reviews across the period.
Trend
Month by month, the path was not a straight line but it leaned steadily downward: 33.1% negative in February, 32.4% in March, 31.5% in April, then a bigger step down to 26.3% in May, a small rise back to 28.0% in June, and 22.5% in July.
4 of 5monthly moves in the improving direction
That June rise matters. Of the five month-to-month moves in this window, four went in the improving direction and one did not - negative share climbed from 26.3% to 28.0% before falling again the following month. A category can be genuinely improving over six months and still have a month that looks like a step backward inside it.
One month bucked the trend entirely: negative share rose from 26.3% to 28.0% in June before falling again in July.
Part of the story here is scale, not just sentiment. Review volume nearly quintupled over the same window, from 683 reviews in February to 3,339 in July. That growth doesn't invalidate the trend - the negative share is still a percentage, not a raw count - but it does mean July's 22.5% and February's 33.1% are being measured against very different sample sizes, and a category picking up that much new review activity is worth watching for how the mix holds up as it keeps growing.
What this finding does not say is that every app in the category got better, or that the improvement will continue in a straight line into August and beyond. It is a catalogue-wide average across however many Graphics & Design apps Appeye tracked in this window, measured once, on 9 September 2026. A single app in the category could be moving the opposite way and still be sitting inside a category-wide improvement like this one.
Review volume in the category nearly quintupled over the same window, from 683 reviews in February to 3,339 in July.
What this means for you
- Marketer
- A category-wide drop in negative reviews is a decent tailwind for ASO messaging, but the June uptick is a reminder not to promise a straight line - build the campaign around the six-month figure, not the most recent single month.
- App owner
- If your app sits in Graphics & Design and your own negative share hasn't moved since February, you're now falling behind a category average that dropped 10.6 points - that's worth checking against your own review data specifically.
- Agency
- This is a usable benchmark when pitching or reporting on clients in this category - a 10.6pp improvement over six months, across 10,335 reviews, measured 9 September 2026 - but flag the June reversal so the client doesn't expect monotonic month-over-month gains.
See how your app compares
Search Appeye for any app to see its real store-by-store scores, review themes and category rank.
Search appsGet new review-data posts by email
One short email when a new Industry Watch or data-driven post goes live. We send a confirmation link first, and every email has a one-click unsubscribe.