Video Players & Editors Get One-Star Reviews at Twice the Catalogue Rate
Sourced from real App Store and Google Play review data in Appeye's catalogue.Video Players & Editors in the catalogue
Figures as of 4 September 2026.
- Negative reviews in Video Players & Editors
- 20.3%
- Catalogue-wide average negative share
- 10.1%
- Share of all ratings that are 1-star
- 16.6%
- Apps in the category
- 151
Split
- 1-2 Star (Negative)20.3%
- 3 Star (Neutral)4.5%
- 4-5 Star (Positive)75.2%
Open the reviews for almost any video editing or playback app and you'll find a strange split: a wall of five-star praise sitting right next to a disproportionate pile of one-star fury. The numbers back up the feeling.
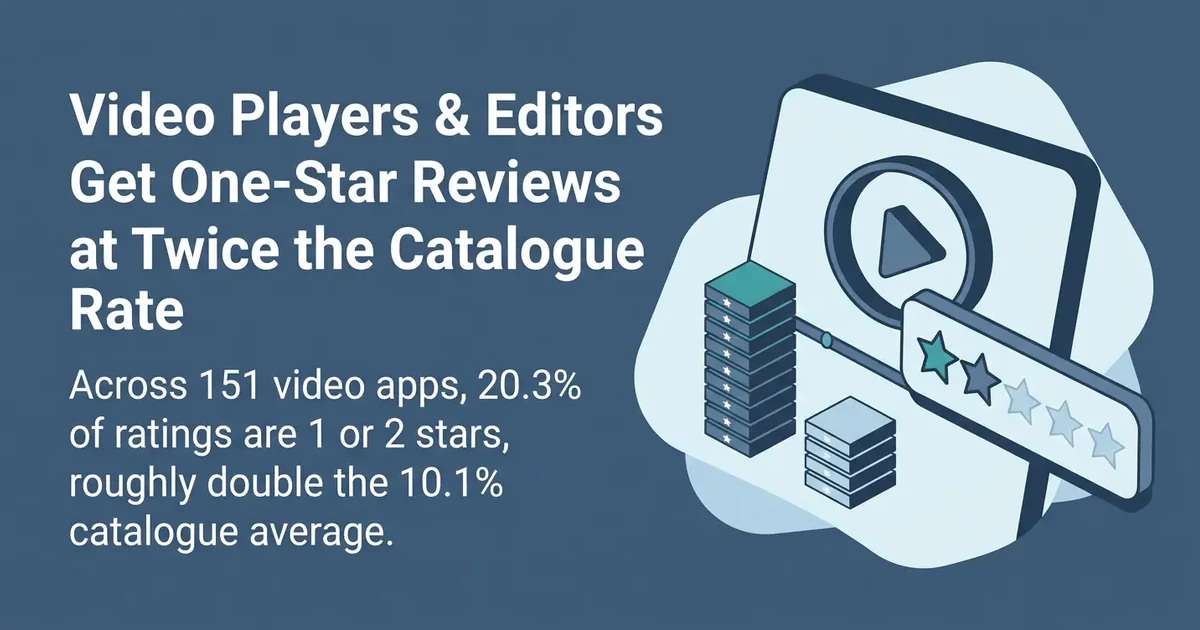
Across 151 apps in the Video Players & Editors category, 20.3% of all star ratings are 1 or 2 stars. The catalogue-wide average for negative ratings, across every category Appeye tracks, is 10.1%. That means video apps get hit with a negative review roughly twice as often as the typical app on the store.
Breaking down the full distribution makes the shape of the problem clearer. 1-star reviews alone account for 16.6% of all ratings in this category, which is already more than the entire negative share (1+2 star combined) of the average category. 2-star reviews add another 3.7%. On the other end, 5-star reviews still dominate at 67.6%, and 4-star sits at 7.6%, so the positive share (4+5 combined) is 75.2%. The quiet middle, 3-star reviews, is only 4.5%.
What that adds up to is a category with very little neutral ground. Three out of every four ratings are strongly positive, but one in five is strongly negative, and almost none of the ratings sit in the ambivalent 2-to-3-star zone. Compare that 4.5% middle slice to the 20.3% negative slice: unhappy users in this category aren't lukewarm, they're voting with a single star.
One in five ratings in Video Players & Editors is a 1 or 2-star review, roughly double the 10.1% negative rate seen across the catalogue.
It's worth being precise about what this finding does and doesn't say. It doesn't mean video editing apps are worse products than the average app, and it doesn't mean 151 apps are all failing in the same way. The 67.6% five-star share is still the single largest slice of the pie, and plenty of these apps have loyal, satisfied user bases. What the data does say is that this category, as a whole, produces negative reviews at close to twice the rate you'd expect from an average app, and that the one-star bucket specifically is doing almost all of that work.
Categories like this tend to share some structural pressures: heavy processing demands, export and rendering steps that can fail on lower-end devices, watermark or paywall moments right after a user has invested time in editing a clip, and permissions requests that touch photos, microphones, and storage all at once. None of that is proven by this dataset, but it's consistent with a pattern where the failure mode is binary; either the export works and the user is delighted, or it doesn't and they leave immediately with a one-star review rather than a measured three-star complaint.
For anyone building or maintaining an app in this space, the practical read is that the catalogue-wide 10.1% negative benchmark isn't the right yardstick to hold yourself against. If your app sits at 20.3% negative, you're at the category norm, not an outlier within it. The more useful question is how far below that 20.3% figure your own app can get, and whether your 1-star share specifically, the number driving almost all of the gap, can be brought down closer to the 3.7% seen in 2-star reviews rather than staying stacked at 16.6%.
The broader lesson holds beyond video apps: category averages are not universal averages. A negative share that would be alarming in one type of app might just be the baseline in another. Knowing which one you're being compared to changes what 'normal' looks like, and 20.3% versus 10.1% is a two-times gap worth knowing before you panic, or relax, about your own numbers.
Explore this in the catalogue
All Video Players & Editors apps (587 tracked)
See how your app compares
Search Appeye for any app to see its real store-by-store scores, review themes and category rank.
Search appsGet new review-data posts by email
One short email when a new Industry Watch or data-driven post goes live. We send a confirmation link first, and every email has a one-click unsubscribe.